Do you want to invest successfully and spend a lot of time analyzing the market?
It is natural that a trader draws lines or figures on a chart and this is known as Chartist Analysis. It is based on lines made by a trader in order to guess the next price move. There are a lot of strategies that are based on chartism among which we find: triangles, wedges, supports among other. These concepts have been taught and transmitted through several generations, gradually increasing the level of trust in chartist analysis as a trading strategy.
The creator of this type of analysis was the American economist Charles Henry Dow (known for the Dow Jones index). According to its assumptions, financial markets behave in a cyclical way: after a given time segment, the trends or behaviour of the quotes are repeated.
To successfully invest in any business you must master a number of tools, since, at the time of analysis, there are no fixed rules or parameters, only the trader’s experience and perceptions count. Note that the problem is that this type of purely visual analysis can be influenced by the deception of the mind and its cognitive prejudices.
Chartist figures
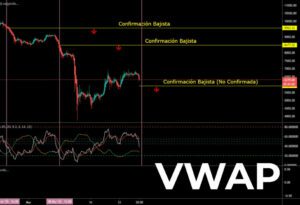
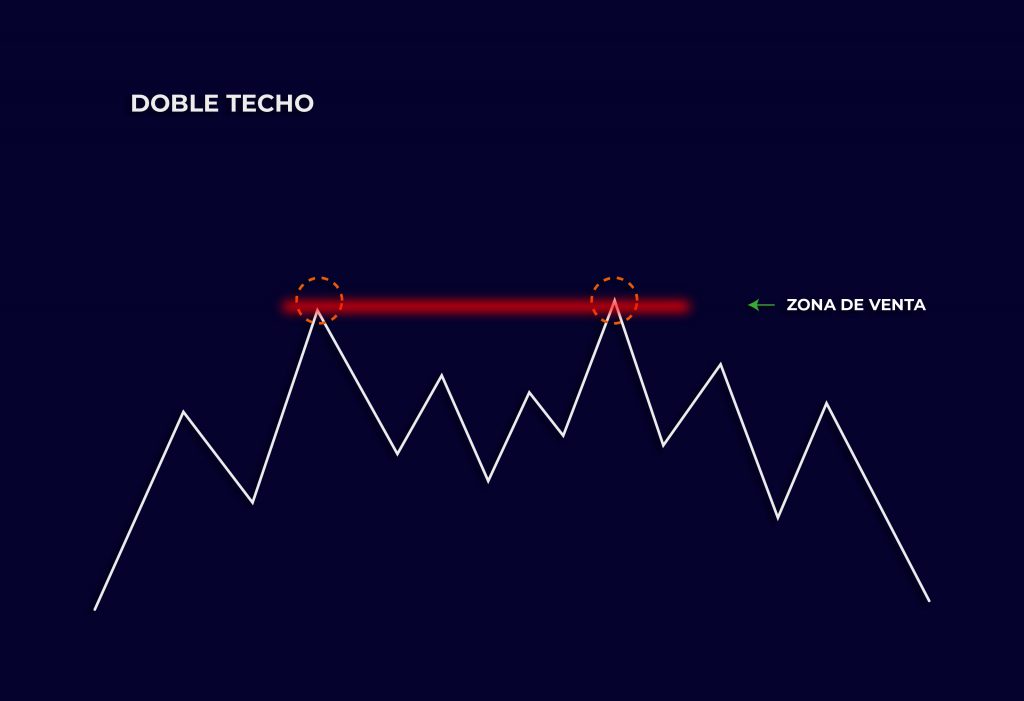
DOUBLE TOP:
The double top is a classic reversal model that announces a potential upward downward trend. To work well this model is necessary to have some degree of experience as it is often misleading in many situations. That’s where other types of strategies come in as they are price action and the interpretation of Japanese candles .These tools will provide you with more information to make a better decision.
It is important to note that after double maximum, retracement must be deep enough to break the level of support to ensure that it is not the beginning of a lateral tendency.
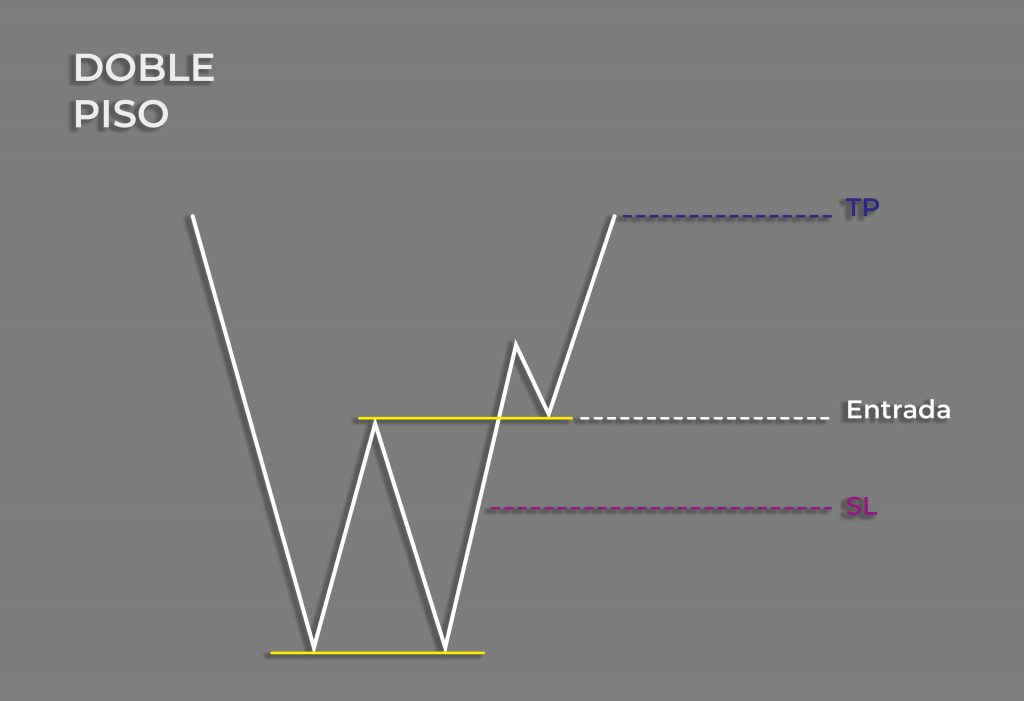
DOUBLE FLOOR:
This chartist figure, as its name suggests, try to tap the same level of support that the trader puts as a reference. Like the double top, it is always difficult to understand that you are faced with this scheme because there are false breaks or manipulations that large institutions put in place to confuse the less experienced. This is why your level of knowledge must be clear for the interpretation of these figures.
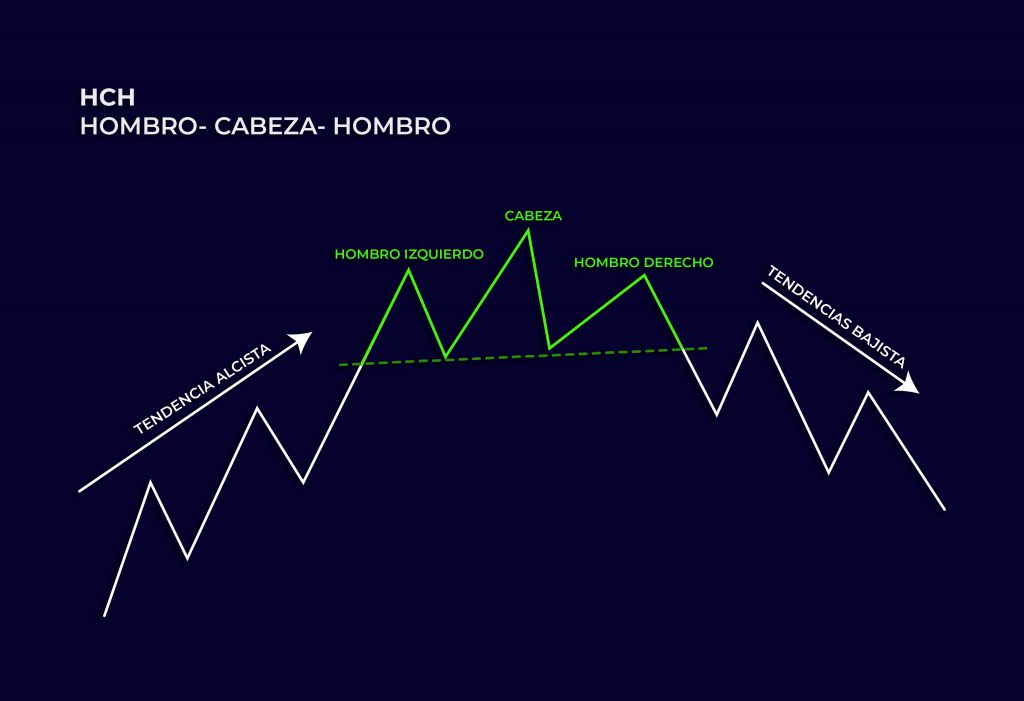
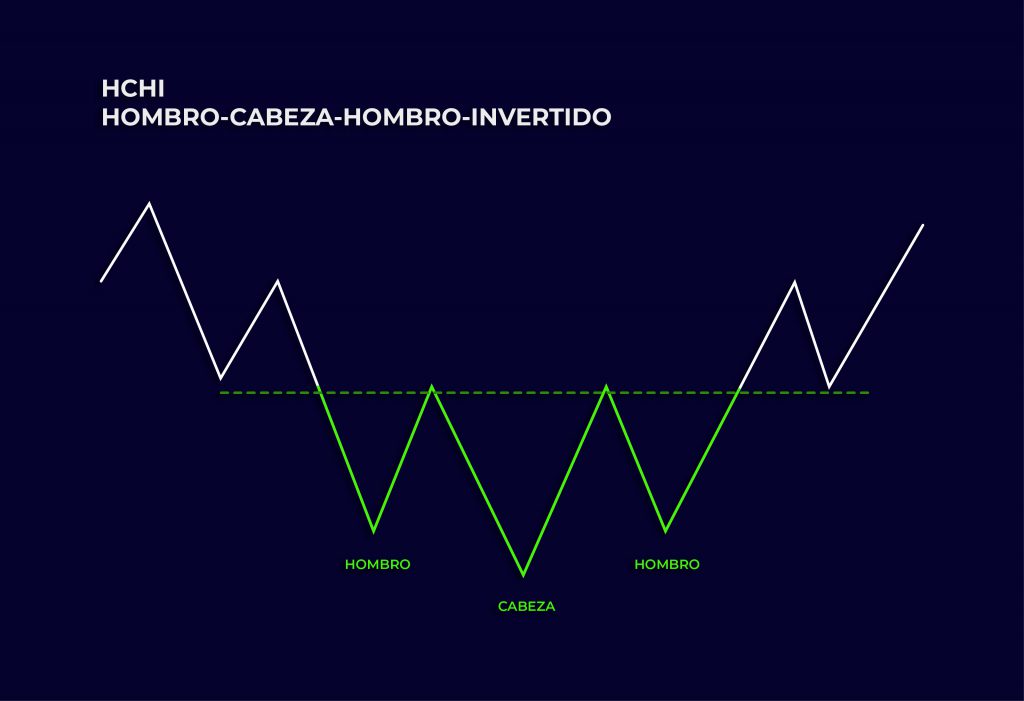
shoulder head shoulder (ETE):
Figure HCH is used to anticipate a change of trend from bullish to bassist, which usually occurs in about 70% of cases.
Graphically, it consists of a central bullish attempt (the “head”), preceded by a previous bullish attempt whose maximum is lower (“left shoulder”) and followed by a rear bullish attempt whose maximum is lower (“right shoulder”) . A trend line, called the neck line or clavicle line, joins the lows of the chart figure.
The optimal investment decisions will obviously consist in the attempt to sell, or at the peak of the left shoulder or (the best possible case) at the peak of the head. There is one last chance at the peak of the right shoulder, but since the volume is much smaller, an institutional investor might have trouble getting rid of the stocks for the lower demand.
Finally, it should be noted that there is also the figure that describes the inverse phenomenon, which is that of the shoulder upside down, in which it indicates a change of tendency from bass player to bullish player. Apply all of the above, even if the raised and bass phases described are obviously contrary.
Chartist triangles:
There are different types of triangles in chartist figures, but among the most important and common we find: symmetrical, ascending and descending triangles. Each provides additional and more information when we are in a trend.
Symmetrical Triangles:
They are more effective when they are in the middle of a trend. They are characterized because the price is compressing, that is it is realizing lower and lower highs and minimums always higher to the point that the price performs a breaking movement. The way he works depends on where we are in the chart. For example, if we are in an uptrend, the ideal is to enter the market at the last possible minimum purchase and determine its projection with the help of the “trend line” tool. So we can measure the distance in the widest part from the beginning of the triangle and move that line to the breaking point.
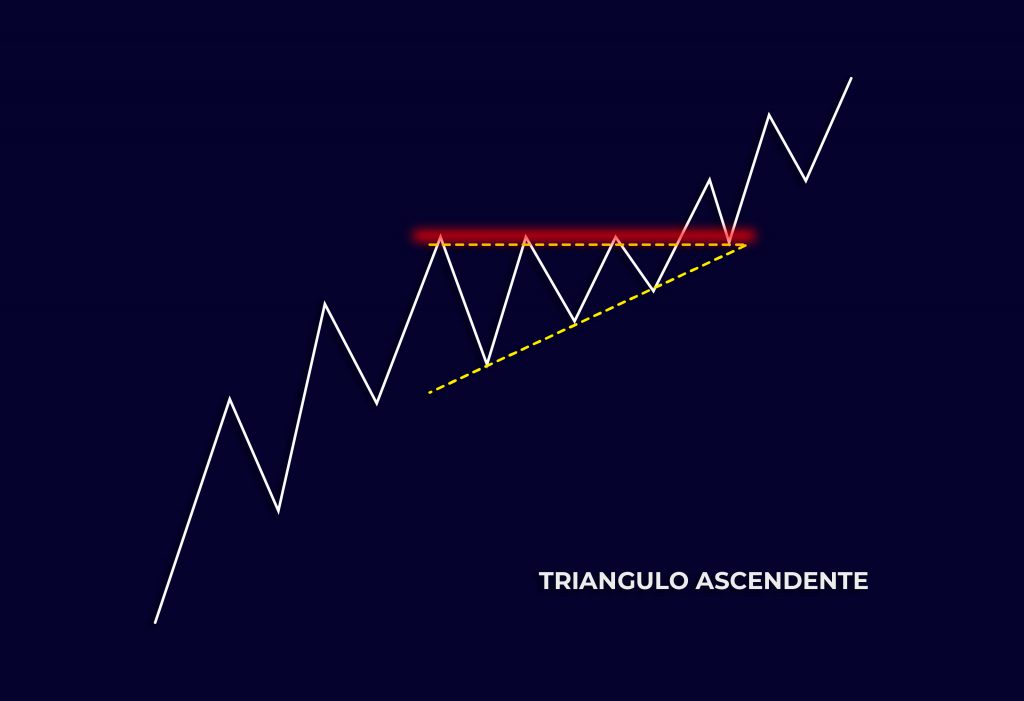
Ascending trianglei:
This figure is most often found in an upward trend and is highly reliable. It is characterized by higher and higher lows, but the highs tend to be at the same level forming a resistance. When it is close to reaching the narrowest point of the triangle, there is the break by making a bullish movement.
It’s an effective model, where we look for purchases when the analysis is clear. It usually provides good percentages of profit but must keep in mind that there is always a risk in every operation and that is why it is very important to use Stop Loss.
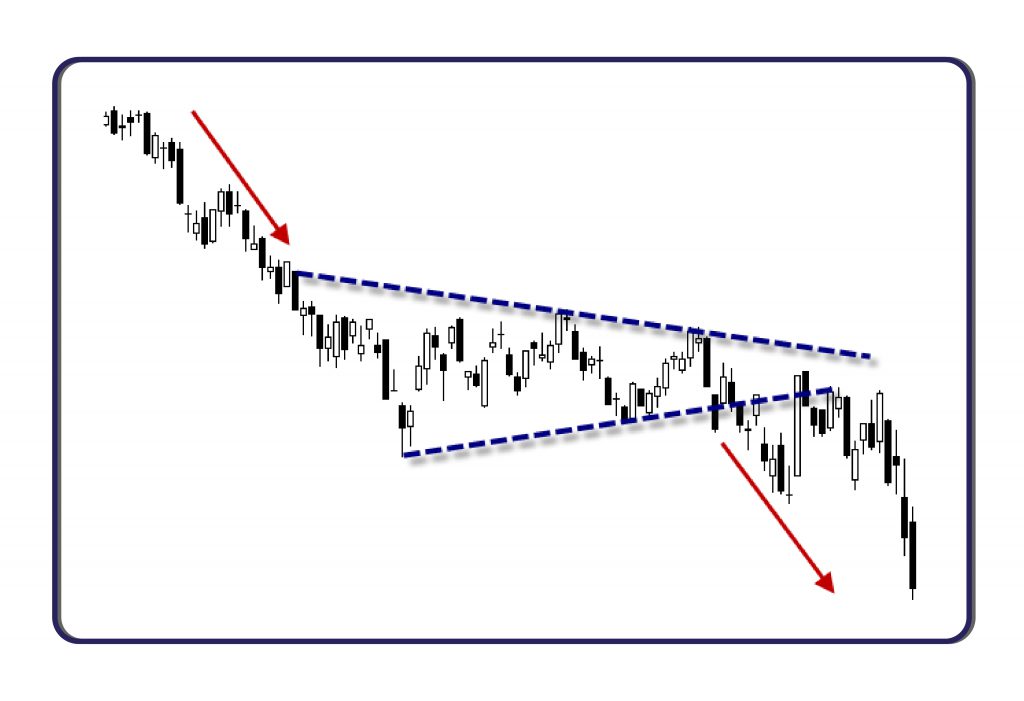
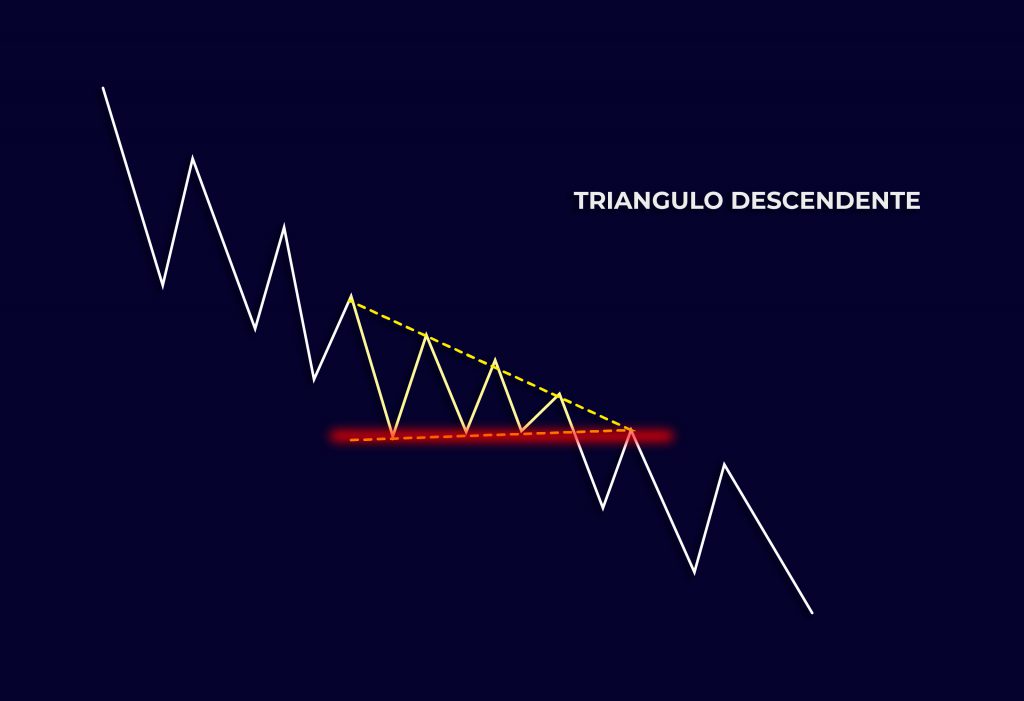
Descending triangle:
This type of triangle is characterized by the realization of lower and lower highs. His way of operating is to get close to the break for sale, because its nature is to be in the midst of a downward trend. Traders tend to make a lot of leverage on the figures that make the price and , this is why we need to understand at what stage of the market we are to identify the degree of trust of a figure.
There is a abundance of patterns in chartism like: wedges, flags, among others. All are very useful and will help you understand why the price performs certain moves on the chart. Your job as a trader is to acquire all these basic knowledge but above all to put them into practice, strengthening your trading with all the information you find on Bitnovo and other sources of trust.