To be more likely to make the right decisions in the financial markets, we use technical analysis and, within this, the types of trading indicators.
These help the retailer in the interpretation of a graph and although there are many types of indicators, among the best known are: moving averages, RSI or bollinger bands. Although they are not completely reliable, they give us a pretty good idea of whether the price is about to change a trend or it is oversold or overbought.
In trading, indicators are different tools that the trader has when facing a chart and intuiting its movements. This is why there are many types of indicators as each one is adapted to the style of each trader.
In this article we will highlight those indicators most used in technical analysis.
Types of technical analysis indicators
Oscillation indicators
These are among the most used and are characterized because they tend to make a similar movement to the price. It will show us if the asset or pair we are analyzing is in an overbought or oversold zone. However, the fact that the indicator enters one of these two zones does not mean that we should open the position. It is essential to have more confirmations to make such a decision. Among this category the most well known are:
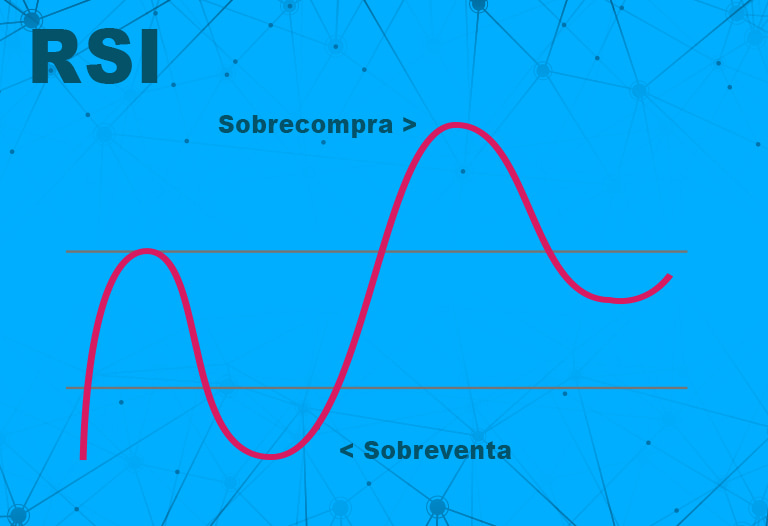
- Relative Strength Index or RSI: Perhaps the most used to indicate whether the price of an asset is oversold or overbought, it represents it through a moving line that averages the price and follows it, it is also used to find divergences between the indicator and the price of the asset. The RSI formula takes into account two equations that intervene in the resolution of the formula: The first component equation obtains the initial relative strength value (RS), which is the average of the rising closings above the average of the falling closings, over a period “N” represented in the following calculation: RS = Exponential moving average of ‘N’ rising periods / Exponential moving average of ‘N’ falling periods (in absolute value).
- MACD: stands for Moving Average Convergence Divergence. It is the convergence and divergence over time of two moving averages of an asset’s price.
To interpret this indicator you must understand the crosses between the MACD and the Signal line which depending on its direction can give you upward or downward indications:
– When the MACD line crosses the Signal line from top to bottom the signal will be downward.
– When the crossing of the MACD line with the Signal line occurs from the bottom to the top, the signal will be bullish.
Volatility indicators
This type of tool studies the movements that the price makes and in turn measures the force as it moves up and down. They serve to determine if the asset has a high volatility appearing aggressive or if it is constant and slow. Among the most popular and used we will find:
- Bollinger Bands: is one of the most recognized indicators to mark the level of volatility that has a trend, although this is a visual issue from the chart the formula of this indicator can give you an approximation of how far an asset could extend through its bands, ie buy from a top band and a bottom band where it tries to enclose the price and a middle line that will indicate the average price of the bollinger band.
The way to trade or interpret it is based on the fact that, if the price exceeds the lower band is in the middle or beginning of a downward trend and it will be good to seek to buy validating with your trading plan, then when it exceeds the upper band is time to sell, the bands can simulate a level of support and / or resistance depending on the case.

Trend indicators
As the name implies, it helps to mark and know the next trend. This type of indicator usually averages, according to a parameter based on number of periods, the price movement that an asset has had in a certain time. The most used and known by traders are simple moving averages, and from these other types are derived according to their configuration.
- Moving Average: It comprises a line or a pair of lines drawn within the graph, which are characterized by following the trend. That is, if the price rises the indicator will also rise and vice versa. It is used to confirm if the trend is up or down and to identify this it is necessary to understand the crossing that the indicator must make. For example: Moving average (50)
Moving Average (100) – If the moving average of (50) crosses up to the longer period moving average or slow for the case (100) this is interpreted as buying momentum and the trend force will be upwards.
– If otherwise the fast moving average or (50) passes below the moving average of (100) it is considered a sell signal or downward trend.
It is important to remember that there is a great quantity and variety of technical analysis indicators that in principle will provide information for decision making. But it is also necessary to clarify that none of these has an absolute truth about the next move that will make the price.
This is because large movements are generated by large financial institutions and they already have a defined plan with an asset. In short, traders should be aware of what is most likely to happen with the help of any of these tools.