The interpretation of a graph is something fundamental at the moment of making decisions of purchase or sale. Although we know that there are different types of charts, the Candlestick has become the most used by traders. This is due to the reading capacity they have.
But what is a Japanese candle? Japanese candles are a way to graphically represent the evolution of an asset’s price in a given period of time. They show the behavior of traders or investors and therefore, if analyzed correctly, it is possible to determine the future of the market to better choose our investments.
The origins of these investments go back to 18th century Japan, where they began to be used in the rice market. A trader known as Homma was the one who developed this type of candle, and later Steve Nison was in charge of introducing the concept to the Western world.
Thanks to Steve, Japanese candlestick charts offer more information than traditional bar charts. And that is why many investors choose them over any other type of analysis for trading cryptos on exchanges.
Structure of a Japanese Candle
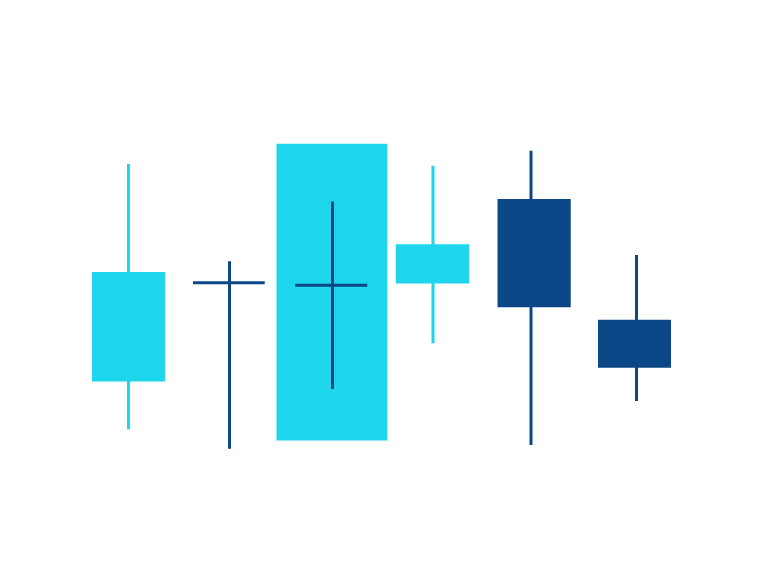
This type of graph is usually represented by a series of bars, usually green and red (although the color usually varies), with a thinner line crossing each bar vertically. As with other types of charts, the X-axis (horizontal) represents time and the Y-axis (vertical) represents the price of the asset.
Let’s analyze its composition in more detail:
Body: this is the widest part of the candle. If the last price the stock has had during the period the candle represents is higher than the first, the body of the candle is usually green, and if it is lower, red. If the bar is green, the lower end of the body indicates the opening price of the candle and the upper end indicates the closing price. If the candle is red, the upper end of the body will show the opening price of the period and the lower end will show the closing price.
Shadow: This is the thin line that crosses the bar vertically. The upper end of the shadow marks the maximum price that the value has had during the period and the lower end the minimum price.
Knowing this, we can understand what a Japanese candle transmits and its composition. If you want to learn how to interpret the charts for trading with crypto currencies read on and you will know the types of candles that attract a trader’s attention.
Types of Japanese Candles
Reverse Candles
-
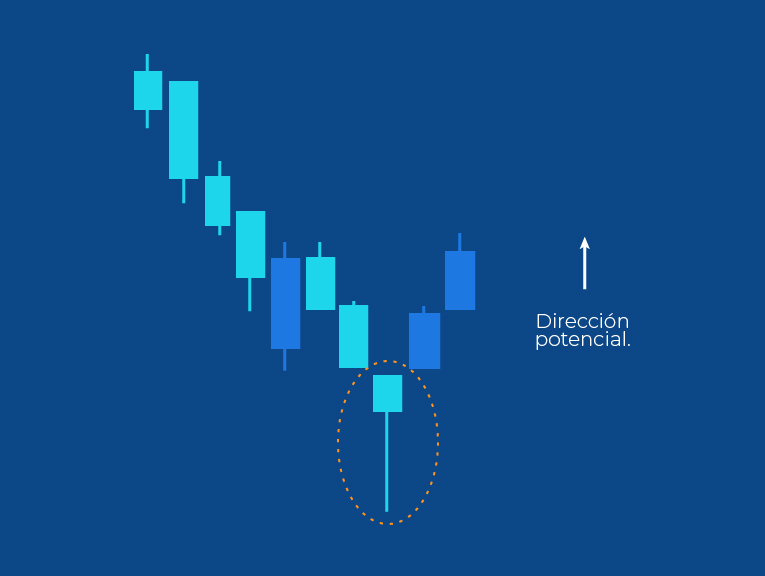
Candles Hammers / Inverted hammer / train tracks
Here we mention the most common candles according to their nature. These are quite effective and are the ones that traders most expect when entering into a trade and will be more reliable in reversal zones or price turns.
That is, if for example there is a downtrend the ideal is a hammer candle in the lower zone of the trend, or on the contrary if the uptrend the ideal is an inverted hammer.
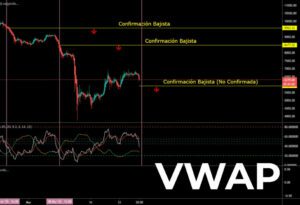
Follow-up candles
-
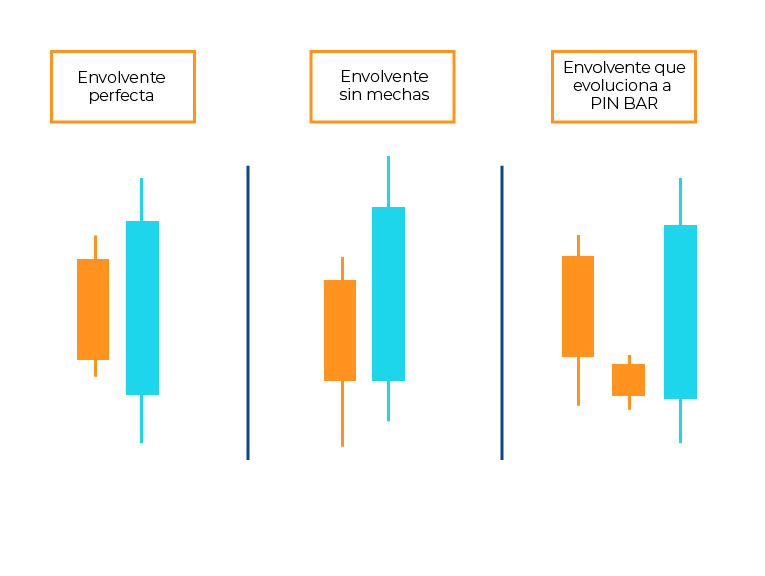
Bullish or Bearish Wrapper / Man on the Hook (In Trend Reversals)
These are common to observe when confirming the trend. In the case of wrap-around candles, ideally it should be 3 times larger than the previous candle, however, there are different types of wrap-around candles.
On the other hand, the hanging man is similar to a hammer, what varies is the position where it appears. It usually appears in the middle of an upward trend but in the corrections of each impulse.
Indecision candles
-
Doji candles / High wave / Spinning tops.
It is natural to see this type of candle near high or low areas. These indicate that the trend is being neutralized and the market is already losing strength. That is when you can interpret that large investors are liquidating their positions, either buying or selling depending on the position.
In Crypto trading it is very important to know how to interpret a chart. In this article we only mention some of the most common Japanese candles and how they can be interpreted.
However, in the world of trading nothing is an absolute truth, as each trader has a different perception of the other. While some enter the market in sales others surely choose to buy crypto currencies.
It is there where you must make a good technical analysis and design a strategy taking into account the Japanese candlestick patterns and what each one transmits depending on the area it appears within a chart.